$10 x (120/100) =
$10 x 1.2 = $12
Potential Profit = $12
Total Potential Payout = Profit + Stake
= $12 + $10
= $22
- Real Money Gambling
- Online Casino
- Sports Betting
- Reviews
Calculating Payouts From Moneyline Odds
 Author:
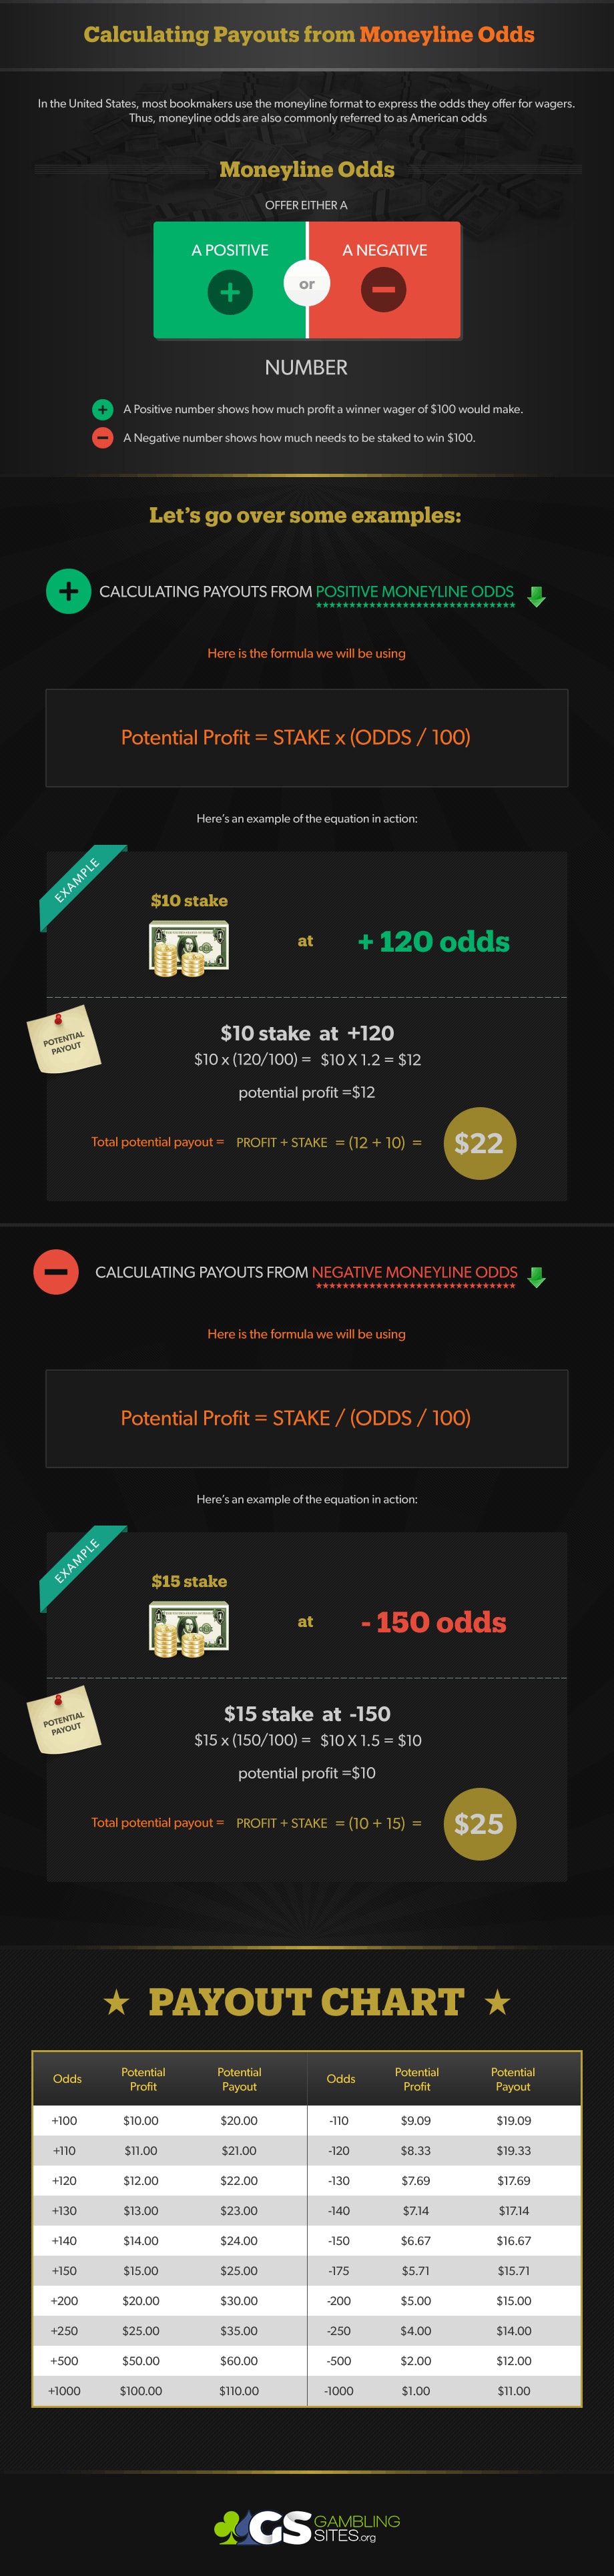
 In the United States, most bookmakers use the moneyline format to express the odds they offer for wagers. Thus, moneyline odds are also commonly referred to as American odds. They can be either a positive number or a negative number. A positive number shows how much profit a winning wager of $100 would make, while a negative number shows how much needs to be staked to win $100.
On this page, we show how to calculate potential profits and payouts from moneyline odds. We also include a payout chart as a useful reference, as well as a comprehensive infographic as a visual summary of everything on this page.
MONEYLINEDECIMALFRACTIONALPAYOUT
Calculating Payouts From Positive Moneyline Odds
The following simple equation is used to calculate the potential profit of a wager with positive moneyline odds.
Potential Profit = Stake x (Odds/100)Since you also get your stake back with a winning wager, this needs to be taken into account when calculating your total payout. Let’s use a couple of examples to illustrate how this works.
Example 1 – $10 Stake At +120Example 2 – $30 Stake At +180$30 x (180/100) =
$30 x 1.8 =$54
Potential Profit = $54
Total Potential Payout = Profit + Stake
= $54 + $30
= $84Calculating Payouts From Negative Moneyline Odds
The equation required to calculate the potential profit of a wager with negative moneyline odds is different. Please note that the negative sign in the odds is ignored in this calculation.
Potential Profit = Stake / (Odds/100)Again, your stake will be added when your total payout is calculated. Here are a couple of examples of potential payouts.
Example 1 – $15 Stake At -150$15 / (150/100) =
$15 / 1.5 = $10
Potential Profit = $10
Total Potential Payout = Profit + Stake
= $10 + $15
= $25Example 2 – $50 Stake At -200$50 / (200/100) =
$50 / 2 =$25
Potential Profit = $25
Total Potential Payout = Profit + Stake
= $25 + $50
= $75Moneyline Odds Payout Chart
The following chart shows the potential profits and total payouts per $10 staked at a selection of commonly used moneyline odds.
Odds Potential Profit Potential Payout Odds Potential Profit Potential Payout +100 $10.00 $20.00 -110 $9.09 $19.09 +110 $11.00 $21.00 -120 $8.33 $19.33 +120 $12.00 $22.00 -130 $7.69 $17.69 +130 $13.00 $23.00 -140 $7.14 $17.14 +140 $14.00 $24.00 -150 $6.67 $16.67 +150 $15.00 $25.00 -175 $5.71 $15.71 +200 $20.00 $30.00 -200 $5.00 $15.00 +250 $25.00 $35.00 -250 $4.00 $14.00 +500 50.00 $60.00 -500 $2.00 $12.00 +1000 $100.00 $110.00 -1000 $1.00 $11.00 Below we have also put together an infographic explaining all of the information on this page. This is a useful tool for someone who wants to see a visual explanation of how to calculate your payouts when using moneyline odds in your betting. You can save this graphic for your own personal use or use the embed feature to put it up and share with others.
Embed this infographic on your site:

Recognize Us? We've been found on:


 Copyright © 2024 GamblingSites.org. All Rights Reserved.

 We're sorry, residents of your region are not accepted by this gambling site! OK
 - Online Casino